

For us at EarningsBeats.com, earnings season is the time to do our research to uncover the best stocks to trade over the next 90 days, or earnings cycle. We do this in various ways. Our flagship ChartList is our Strong Earnings ChartList (SECL), which honestly is nothing more than a sophisticated WatchList that organizes annotated charts with key price/gap support levels, simply as a reminder throughout the next quarter as to where might be great entry points. These stocks typically have great price/volume combinations, excellent relative strength, and rising AD lines (accumulation/distribution lines).
Currently, we have 301 stocks on our SECL and all of our prior Model and Aggressive portfolio stocks have been on this ChartList. One of the keys is that SECL companies ALL have beaten Wall Street consensus estimates as to both revenues and earnings per share (EPS). It guarantees us an element of strong fundamentals and confirmed management execution, I believe necessary ingredients to long-term growth.
On Monday, we’ll be unveiling the 10 equal-weighted stocks in our Model and Aggressive Portfolios for the next 3 months. But before we announce those stocks, much analysis needs to be done. For purposes of this article, I’ll give you a couple names that I’m considering strongly for one of our portfolios, based upon their quarterly results and their technical outlook.
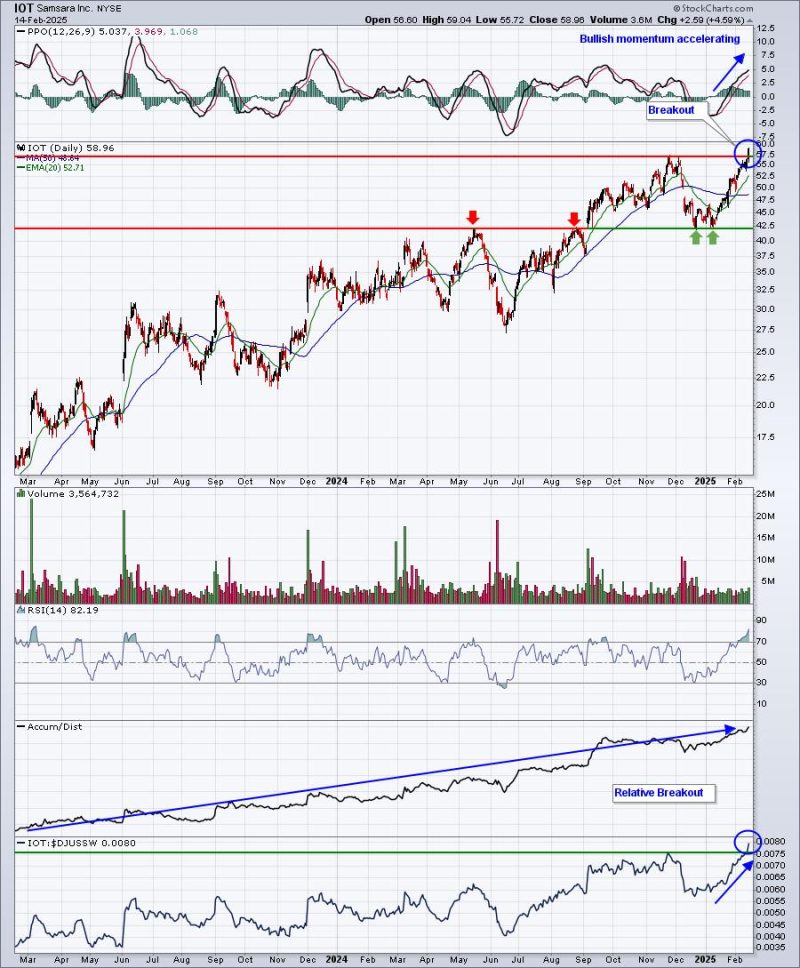
Samsara, Inc. (IOT)
There are plenty of stocks to choose from in software ($DJUSSW), so IOT may or may not make our final cut. However, the strength here, both absolute and relative, is apparent. We just saw both the absolute and relative price break out to all-time highs. So too did the AD line. The uptrend is alive and kicking, if not strengthening. IOT will be reporting its quarterly results on March 6th, which is only a couple weeks after our portfolio “draft”. Having earnings so close can be a really good thing or a really bad thing. Currently, IOT’s significant relative strength vs. software suggests to me that the most recent quarter has been a very strong one, which could propel IOT substantially higher very quickly when results are released, helping to lead a portfolio higher. But what if IOT misses its estimates or lowers future guidance? We have a history of holding our portfolio stocks for an entire 90-day period without stops. Of course, our EB members can decide on their own how to handle both gaps to the upside or to the downside as a result of quarterly results. But holding a stock for 90 days after lowering guidance can be dangerous.

For our next potential portfolio stock, how about a household name that consolidated for two years before breaking out, then pulled back to test that key support level?
Coca Cola Co. (KO)
Surprisingly, KO beat its most recent quarterly revenue consensus estimate by 8-9% and easily surpassed its EPS estimate as well. Could this be a steady influence for a portfolio for the next 90 days? Should we consider that KO’s best two-consecutive-calendar-month period over the last 20 years is March and April?
There’ll be a lot to think about over the next 24 hours as we prepare to release our portfolio selections. Can we repeat our stellar results of the last couple quarters? Check this out:
Model Portfolio:
For the period November 19 through Friday, February 14th’s close:
- Model Portfolio: +15.15%
- S&P 500: +3.34%
For the period August 19 through November 19:
- Model Portfolio: +20.89%
- S&P 500: +5.50%
Aggressive Portfolio:
For the period November 19 through Friday, February 14th’s close:
- Aggressive Portfolio: +9.37%
- S&P 500: +3.34%
For the period August 19 through November 19:
- Aggressive Portfolio: +25.75%
- S&P 500: +5.50%
This is unreal outperformance, especially when you consider that these are quarterly results! Any portfolio manage would love to beat the benchmark S&P 500 by 1 percentage point annually. Both our Model and Aggressive portfolios have beaten that benchmark by more than 25 percentage points over the past 6 months.
I showed our “since inception” Model Portfolio results vs. the S&P 500 in a graph in yesterday’s article, but it’s worth repeating:
That’s a lot of outperformance over the past 6+ years. And we’re going to try to do it again. We’re “drafting” the 10 equal-weighted stocks in our portfolios on Monday, February 17th at 5:30pm ET. This is a members-only event, but we do have a 30-day FREE trial for those interested in checking out our strategy. For more information about the event and membership, click HERE.
Happy trading!
Tom
